overview
issues
primers
engineering
addressing
infrastructure
traffic
Australia
advocacy
convergence
broadband
wireless
private nets
voice
ISPs
hosting
devices
mobiles
|
 Traffic and Access
This
page looks at internet traffic growth rates, costs and
destinations.
It covers -
More
detailed statistical information about the direction and
dimension of traffic flows is provided
in the Metrics & Statistics guide.
 volumes and growth rates
In mid 2001 US router entrepreneur Lawrence Roberts dismissed
a McKinsey & JP Morgan report predicting that IP traffic
would decline from recent 200 to 300% growth to a 60%
annual increase by 2005, with overall IP traffic revenue
climbing from US$13 billion in 2000 to over US$56 billion
in 2005.
Others had criticised that report for overestimating past
growth rates. Vint Cerf for example commented that
I
doubt traffic ever grew at 300 to 400 percent per year.
I think it has been more like 80-100 percent which is
likely to continue, especially as broadband is more
readily available and more widely deployed.
Roberts claimed traffic expanded by a factor of 2.7 until
January 2000, when it jumped to 3.6 for the year. In the
first six months of 2001, expansion hit a factor of 4,
which Roberts expected would remain steady through 2008.
Those claims were questioned by Andrew Odlyzko, one of
the more persuasive analysts of electronic publishing
and online content pricing, in a December 2001 comment.
Odlyzko and K G Coffman had earlier released papers on
Growth of the Internet (PDF)
and Internet growth: Is there a "Moore's Law"'
for data traffic? (PDF).
One
perspective is provided by Ilkka Tuomi's 2002 paper
The Lives and Death of Moore's Law.
Odlyzko's scepticism has been substantiated since the
collapse of the dot-com and telco
bubble, with
 economics
The information economy is built around low cost instantaneous
global communications: the ability to easily send and
receive data (statistics, prose, video, multimedia). Overall,
the cost of pumping bits around Australia - and around
the globe - has fallen dramatically over the past three
decades, in conjunction with increased traffic flows.
Local and international data transmission costs declined
by up to three orders of magnitude over the past two decades.

Price
declines for most consumers have not been that dramatic.
Contrary to George Gilder's prophecies in the millenarian
Telecosm: How Infinite Bandwidth Will Revolutionise
Our World (New York: Free Press 2000) the cost of
being online - and who pays - thus remains a significant
issue.
For a basic introduction to network economics we recommend
Internet Economics (Cambridge: MIT Press 2000),
edited by Lee McKnight & Joseph Bailey. McKnight's
Internet Telephony (Cambridge: MIT Press 2001)
is of particular interest.
 Composition
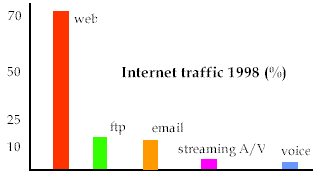
Estimates of the composition of internet traffic are problematical.
As of 1998 it is likely that access to web pages accounted
for around 70% of the traffic, with electronic mail and
file transfer (ftp) at around 10%.
Streaming video/audio has not shown the growth forecast
by some analysts, for reasons that include traffic costs,
low demand for much of the content (watching television
or wet paint is more entertaining than much streamed content)
and disagreement about standards resulting in limited
uptake of proprietary technologies.

The International Telecommunications Union's 2001 workshop
on internet telephony heard that one in 33 international
voice calls during 2000 used the net rather than traditional
telecommunication systems.
Some estimates suggest that by 2004 up to 40% of all international
telephone traffic may be net-based.
A detailed report
presented by the ITU Secretary-General at the 2001 event
suggests the market is now taking off, rising from almost
zero voice calls in 1997 to just over 3% of international
voice traffic (4 billion minutes) last year.
 traffic flows
The metrics guide on
this site points to studies - and some stunning maps -
about internet traffic flows: who is online, where they
reside, the volume of traffic, the growth of sites (and
pages).
Australia is a net importer of internet content (consistent
with its status as a importer of content offline, ie books,
magazines, film, sound recordings). As a result the existing
international traffic charging regimes - biased towards
exporters - are of concern.
Closer to home debate continues about local varieties
of the digital divide, which we've explored in a multi-page
profile. Sociodemographic
Barriers to Telecommunications Use, a major report
for Telstra, for example argues that the Australian 'digital
divide' is one of income and social situation, not geography
- questioning the government's concern with supply to
rural areas.
 next
page (Australia) next
page (Australia)
|
|